The Problem
The client — a power quality and energy monitoring firm — operates measurement infrastructure across large-scale electrical systems, collecting millions of data points per installation over multi-year periods. Their existing analytics system was failing under the weight of this data:
Complex queries against multi-year historical datasets were timing out or producing results too slowly for operational use. Dashboard visualisations were rigid — users could not configure data sources, time ranges, or calculation logic without developer involvement. The legacy architecture had no headroom for additional monitoring sites or extended data retention. Energy analysts with deep domain expertise were spending time working around the tool rather than interpreting the data it contained.
The primary challenge was not just processing speed. It was making years of energy data accessible and interpretable to both expert analysts running complex queries and operations staff who needed to read dashboards without a technical background.
The Constraints
No data loss or service interruption during migration. The client’s monitoring systems were generating live data continuously. The migration had to preserve all historical data without interrupting the data ingestion pipeline that fed the existing system.
Query performance against SQLite at production data volumes. The legacy system used SQLite as its data store — appropriate for the original data volumes, but unsuitable for multi-year, multi-site aggregate queries. The new architecture had to resolve this without requiring the client to change their data collection infrastructure.
Self-service configuration without sacrificing analytical depth. The platform serves both expert energy engineers running complex analytical queries and operations staff reading dashboards without training. Both use cases had to be served without compromising either — the same platform, two different user experiences.
Our Approach
We rebuilt the analytics platform as a browser-based web application with a modular, user-configurable dashboard system — replacing the legacy desktop tool with something the whole organisation could access without software installation.
The key architectural decision was separating the data processing layer from the presentation layer entirely. We moved from SQLite to a relational backend with query paths specifically optimised for time-series and aggregate analytics on large datasets. Pre-computed aggregates at common time resolutions (hourly, daily, monthly) eliminated the most expensive query patterns while keeping full-resolution data available for detailed analysis when needed.
The dashboard system was rebuilt for self-service: data source selection, calculation logic, time range, and visualisation format are all user-configurable at the dashboard level. This eliminated the developer queue that analysts had been working around to see the data views they needed.
We ran both systems in parallel for a validation period before the legacy system was decommissioned, verifying data integrity and query result consistency across the full historical dataset.

The Outcome
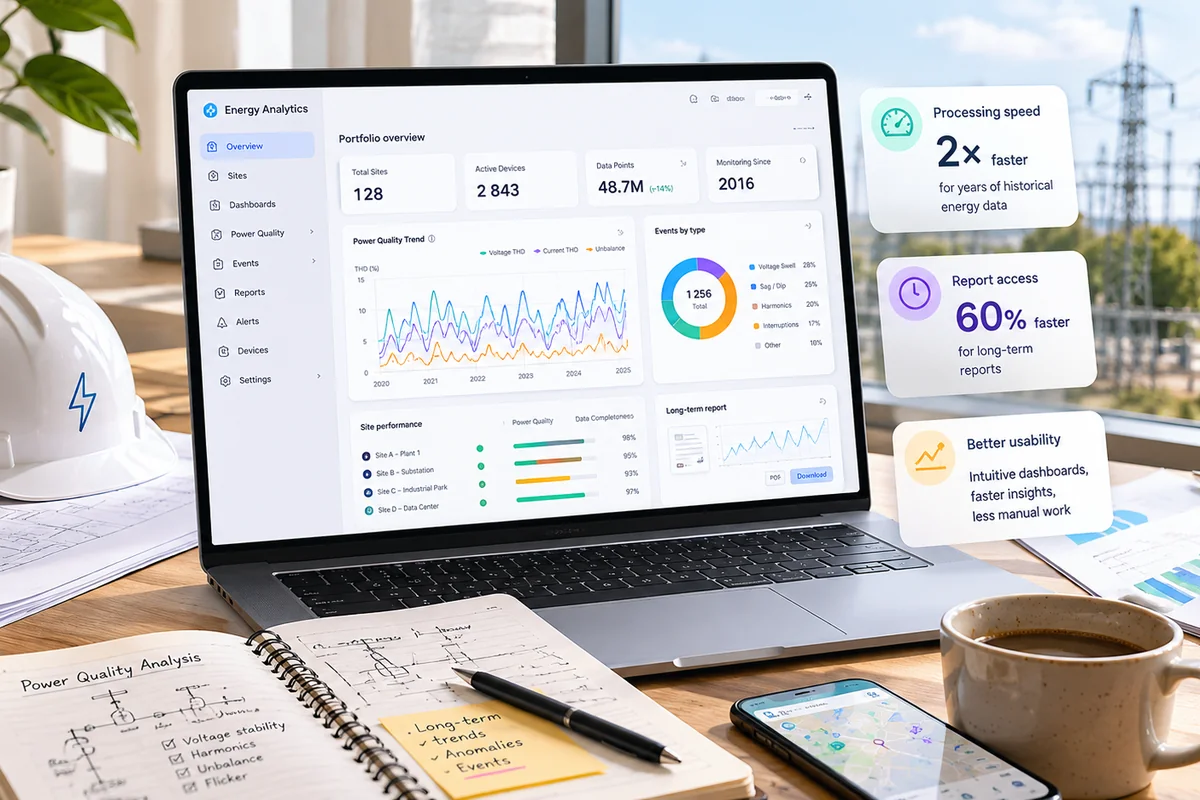
- 2× faster data processing for large historical datasets
- 60% faster access to long-term analytics and historical reports
- 30–50% improvement in dashboard interaction speed
- Full legacy system replaced — the client is no longer operating two environments
- Self-service dashboard configuration eliminated the backlog of developer requests for analytics changes
Team
Engagement: 5 months, 3 engineers (1 backend/data, 1 frontend, 1 QA).
Stack: .NET, Angular, ASP.NET Zero, EF Core, DevExtreme, PrimeNG, SQLite (migrated)